By Quentin Viville, Sudarshan Sawal, and Ernest Chan
PredictNow.ai is excited to announce that we’re expanding our feature zoo to cover crypto features! This follows our work on US stock features, and features based on options activities, ETFs, futures, and macroeconomic indicators. To read more on our previous work, click here. These new crypto features can be used as input to our machine-learning API to help improve your trading strategy. In this blog we have outlined the new crypto features as well as demonstrated how we have used them for short term alpha generation and crypto portfolio optimization.
Our new crypto features are designed to capture market activity from subtle movements to large overarching trends. These features will quantify the variations of the price, the return, the order flow, the volatility and the correlations that appear among them.
To create these features, we first constructed the Base Features using raw market data that includes microstructure information. Next, we applied simple mathematical functions such as exponential moving average to create the Final Features.
Base Features
The Base Features are constructed using Binance’s dollar bar data, which includes:
- Open
- High
- Low
- Close
- Volume
- Order flow (sum of signed volumes)
- +ve volume for buy aggressor tag and -ve volume for sell aggressor tag
- Buy market order value (sum of volumes corresponding to buy aggressor tag)
- Sell market order value (sum of volumes corresponding to sell aggressor tag)
Base Features are based on:
- Relations between the price, the high price, the low price.
- Relative High: High Price relative to Open Price.
- Relative Low: Low Price relative to Open Price.
- Relative Close: Close Price relative to Open Price.
- Relative Volume: Buy orders relative to total absolute volume.
- Target Effort: computes an estimation of the “effort” that the price has to produce to reach the target price by comparing the observed low price and high price.
- Volume exchanged.
- Dollar Speed: Average signed quantity of dollars exchanged per second.
- Relations and potential correlations among the variations of the price, the order flow and the intensity of the activity in the market.
- Kyle’s Lambda: Relation between price change and orderflow.
- SCOF: Correlation of Order Flow with its lagged series.
- VPIN: Volume-synchronized probability of informed trading.
- Volatility observed.
- VLT: Volatility of the returns (Exponentially Weighted)
Each feature is associated with a ‘time span’, or lookback period, which helps capture market activity across multiple time frames.
Final Features
Once we generated the Base Features, a new, varied set of features was derived called the Final Features.These Final Features are transformations of the initial Base Features into exponentially moving averages and probabilities over many time periods.
This approach has allowed us to produce a large set of Final Features (879 features to be exact), which can capture and quantify the activity of the market within any time span we choose.
Applications to Short Term Alpha Generation
PredictNow.ai’s core functionality is metalabelling, which assigns a Probability of Profit for every trade of an existing strategy (or a future time period of an existing portfolio). This requires us to build a machine learning model using a large number of input features and a target (label), which would be the trades’ (or portfolio’s) returns.
To evaluate the performance of the features described above, we first built a base strategy and then applied metalabelling to the signals of that strategy with those features as input. The base strategy is a high frequency strategy which predicts abnormal returns due to unusual order flow. The out-of-sample backtest performance of just the base strategy:
Maximum drawdown: −6.250%
Annualized Sharpe ratio:3.3
Annualized profit: 32.6%
Using the Final Features as described above as input to metalabelling, we have been successful in improving the strategy’s performance drastically. The improved performance after applying metalabelling:
Maximum drawdown: −4.998%
Annualized Sharpe ratio: 5.6
Annualized profit: 227%
Comparative plot to give an idea of the metalabelling model’s performance in comparison to the base strategy:
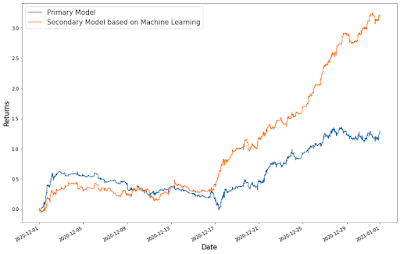
The Sharpe ratio is increased from 3.1 to 5.6 and we have almost 7x the annual returns to 227% by applying metalabelling using our new crypto features.
Applying CPO to Crypto Portfolio
Mean Variance Optimization (MVO) is a popular method of portfolio optimization which generates a portfolio with maximum expected returns given a fixed level of risk. One shortcoming of the MVO method is that the selected portfolio is optimal only on average in the past. This doesn’t guarantee it to be optimal in different market regimes. This limitation gives us an opportunity to apply our patent-pending Conditional Parameter Optimization (CPO) technique.
Our CPO technique can be used to improve strategy performance in different market regimes by adapting a trading strategy’s parameters to fit those regimes. Similarly, it can optimize allocations to different constituents of a portfolio in different market regimes. Rather than optimizing based only on the historical means and covariances of a portfolio’s constituents’ returns, CPO involves training a machine learning model with a vast number of external “big data” features to drive the optimization process.
In our next example, we used our crypto features as input. We then compared the Sharpe ratios of a crypto portfolio based on the conventional MVO technique vs our CPO technique on out-of-sample data.
Backtest Result:
- Portfolios are constituted of 8 symbols (all crypto perpetual futures): BTCUSDT, ETHUSDT, XRPUSDT, ADAUSDT, EOSUSDT, LTCUSDT, ETCUSDT, XLMUSDT
- Position type includes Long and Short Positions
- The target variable is the forward Sharpe ratio, computed as the 3-hour return divided by the standard deviation of the sequence of the 5-minute consecutive returns during the 3-hour period
- Out-of-sample test data set starts on Jan. 2020 and ends on June 2021
- Results (annualized Sharpe ratio over 365 days per year):
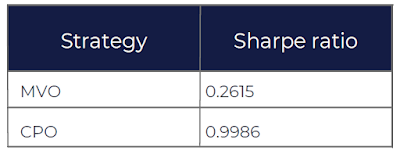
- CPO improves the Sharpe ratio by x3.8!
Conclusion
We have demonstrated that our new crypto features are powerful additions to any crypto trader or investor’s toolkit by applying them to a crypto trading strategy in live deployment, and to optimizing a crypto portfolio using our proprietary CPO technique. Our features and strategy combined with our machine learning software is proven to increase a base trading strategy’s returns by 7x and increase a crypto portfolio’s Sharpe ratio 3.8x over MVO. Additionally, with our Explainable AI function using our feature selection methodology, we’ve removed the guesswork so you’ll know exactly which of our new crypto features are important to improving your strategy.
To sign up for a free trial to experiment with these new features using our API or to explore our machine learning software please click here. Institutional investors can also inquire about subscribing to our trading signals from our crypto strategy or to updates from our dynamically optimized long-short crypto portfolio.
If you have any questions or would like to work with us, please email us at: info@predictnow.ai.