I am of course not privy to the current performance numbers of factor models run by some of the most successful hedge funds today. However, there is a class of ETF (called “XTF”) marketed by PowerShares Capital Management that uses a similar factor approach for its stock selection criteria. According to media reports, each stock in these XTF’s is scored by 25 variables such as cash flow, earnings growth, price momentum, etc. This sounds like a classic factor model to me. This model is reportedly designed by the quantitative unit at American Stock Exchange. To find out if they have indeed discovered the holy grail of factor models, I looked at the performance of these XTF compared to their benchmarks.
Here I tabulate the XTF’s for each market cap and value category, their corresponding benchmark market index ETF’s, and finally the YTD differential returns up to December 13, 2006. (PJG and PJM have too short a history for this comparison.)
| Value | Blend | Growth | |
| Large cap | PWV-IVE=4.8% | PWC-IVV=-3.6% | PWB-IVW=-5.0% |
| Mid cap | PWP-IJJ=0.1% | PJG-IJH=N/A | PWJ-IJK=3.1% |
| Small cap | PWY-IJS=-0.7% | PJM-IJR=N/A | PWT-IJT=-4.9% |
The differential returns are all over the place: some positive, others negative. To me, this is symptomatic of a factor model that does not have predictive power. (After all, if the differential returns are consistently negative, we could have long the ETF, short the XTF, and make consistent profits!) At the very least, this factor model may have a horizon much longer than what most traders would be interested in – in which case, why not just use the simple Fama-French model?
This is not to say that exotic, proprietary factor models have no use: they tend to be pretty useful for risk management, as volatilities and correlations are often easier to predict than returns. But beware every time your risk management software vendor tries to sell you an alpha generator!


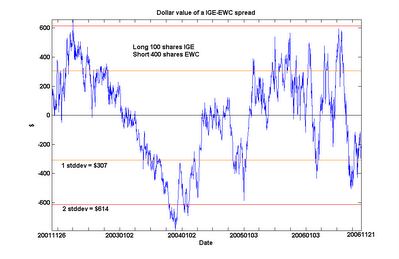
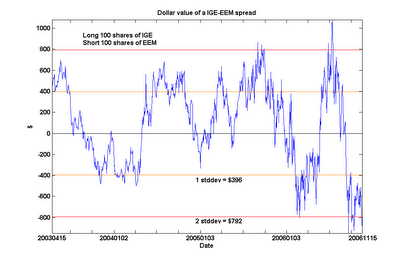 This is not surprising. But does this imply the unsettling conclusion that the Canadian economy cointegrates with the emerging markets? No. I will not bore you with yet another chart: just be assured that cointegration is not a transitive relation.
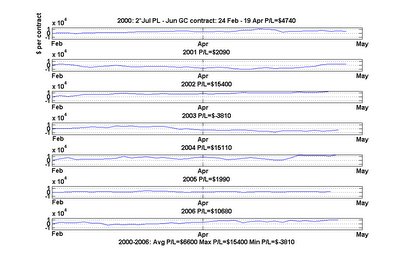
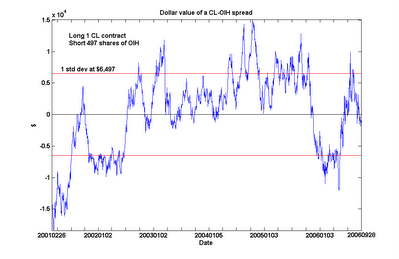
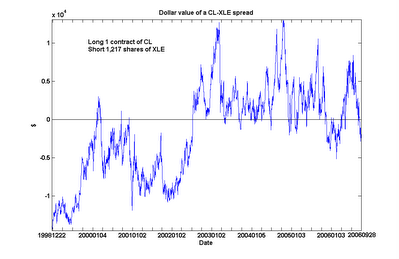 An interesting feature emerged from this extended analysis. CL and XLE are still found to be cointegrated over this long period, albeit with a slightly lower probability (90%). However, we can see something of a regime shift around mid-2002, when CL went from generally under-valued to over-valued relative to XLE. (Even after including this regime with lower relative crude oil prices in my calculations, I still find the current spread to be undervalued by about $10,521 as of the close of Nov 17, which is near its 6-year low.)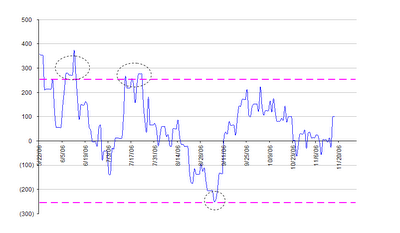


 Now consider stock A and stock C.
 Stock C clearly doesn’t move in any correlated fashion with stock A: some days they move in same direction, other days opposite. Most days stock C doesn’t move at all! But notice that the spread in stock prices between C and A always return to about $1 after a while. This is a manifestation of cointegration between A and C. In this instance, a profitable trade would be to buy A and short C at around day 10, then exit both positions at around day 19. Another profitable trade would be to buy C and short A at around day 31, then closing out the positions around day 40.