This certainly looks like a fairly safe strategy. Of course, if one desires more frequent signals, one can always enter into smaller positions at smaller spread values.
By the way, just when we were celebrating the reversion of the GLD - GDX spread this morning, the QM - XLE spread plunged to another multi-year low. With crude oil prices down about 30% from its all-time-high, XLE, the energy stocks ETF, is still within 5% of its all-time high. Does this make any sense? We shall see after this quarter's earnings from the oil companies are announced ...
33 comments:
EC-
What do you think about the historical SPY ETF and S&P e-mini futures spread? If its not too much trouble do their st. deviation analysis like you did for GLD-GDX. thanks a lot!
Yaser: What you suggested is similar to the classic "index arbitrage" between SP500 stocks and stock index futures. Since the index arb desks of investment banks have been doing this for many years, the spread is likely to be very narrow and typically no longer profitable in recent years. Maybe you heard otherwise? Of course, one can also consider trading the spread between a basket of SP500 stocks and SPY ETF also. But I think the portfolio manager of SPY must have taken care to remove most arbitrage opportunities for us.(However, I like your earlier suggestion of using OIH instead of XLE. I will post an analysis of that next week.) -Ernie
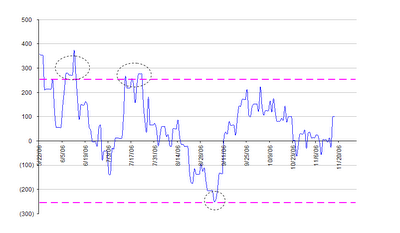
I should add that the standard deviation of GOLD-GDM is $207, not $125 based on the short history of GLD-GDX. So following Mr. Hansen's suggestion of 2xstddev, the entry point would be $414.
Sir,
I am newbie to algo trading.Currently I try to follow your book,now I have some questions.
According to example 3.6
% ensure existing positions are carried forward
unless there is an exit signal positions=
fillMissingData(positions);
I am not really understand how to carry forward those positions and also I can't find the fillMissingData function in spatial-econometrics.com
Thank you very much for your suggestion.
Art
Hi Art,
The fillMissingData function is available for download from epchan.com/book. See last paragraph of page 34 of my book for password.
It simply copies the previous bar's value (price? position? whatever?) to the current bar *if* the current bar's value is NaN.
Ernie
Hi Ernie,
I've been trying to use the backtesting code for cointegrating pairs, and have been using it in conjunction with scraping data from yahoo, for some pairs that I backtest on (most) the sharpetrainset comes up as NaN. any idea whats going on?
Cheers
Hi Anon,
Mostly likely you have included non-numeric data in your input.
Ernie
Hi Ernie,
When I took the GDX.xls and GLD.xls files from http://epchan.com/book/ I got same error as anonymous. However, when I took the files straight from Yahoo Finance I got no NaN result. But I got 3.0 and 5.6 for test and training sharpe ratios respectively, results which did not match what you suggested in your matlab code for example 3.6
Cheers,
Manuel
Hi Lu,
Did you use the same periods for training and testing using Yahoo data?
Your Sharpe ratios sound too good to be true.
When you load my .xls files into Matlab, make sure your price arrays do not have NaN.
Ernie
Dear Arnie,
in the book quantitative trading you calculate the sharp ration for the spread ( for the training set )as
sqrt(252)*mean(pnl(trainset(2:end))).
/std(pnl(trainset(2:end)))
I am not using matlab ( as I dont have the software), how can I use the Sharp ratio for the spread which in excel is in the form of ln(x)-0.78765*ln(y) where x and y are the future prices of the two scripts.
Hi JPS,
You can easily compute the average and standard deviation of daily returns in Excel. Taking their ratio and multiplying by sqrt(252) gives you the annualized Sharpe ratio, assuming 0 risk free rate.
Ernie
Hi JPS,
You can easily compute the average and standard deviation of daily returns in Excel. Taking their ratio and multiplying by sqrt(252) gives you the annualized Sharpe ratio, assuming 0 risk free rate.
Ernie
First of all I want to thank you for this precious book. It is really well written and it is among my bests until now.
I have a question regarding the pair strategy spread : Why are you regressing prices on each other and then checking the spread? Isnt better the calculate the daily return and then check the absolute spread, and finally apply the same strategy as you propose (using the right parameters). Or we can make a regression of the returns and not the prices?
Amine,
Hi Amine,
Thank you for your kind words.
A cointegrated pair of price series means that their price spread will eventually mean revert, but we don't know exactly when. If you look at returns of a fixed lookback, you are forced to look for mean reversion of a fixed timeframe. Please see p.126-133 of my book Quantitative Trading.
Ernie
I'm also with the good comments on the book Mr Chan. I appreciate your effort in putting together such a good piece of knowledge (excuse my English as it is not my mother tongue).
I'm having troubles with program example3_6.m. I have downloaded GLD and GDX series from Yahoo Finance, check whether there are NaNs around but I still get values for the Sharpe Ratio in the test and in the training set NaN. I have checked the code but I don't know where the problem may be.
Trying to debug the code I have come across that positions is pass to fillMissingData with row 1 (both columns) equal to NaN, so the result is NaN. Could this be the problem? Why are these values NaN in the first place?
Thanks in advance and have a nice Xmas and a my best wishes for the next year!
JJ
Thanks for the reply,
I have two questions :
1/ I read the page p126-133 again and I did the cointegration test on the pair GDX,GLD using data from 01/01/2014 to 29/12/2015. Below you can see my results
Augmented DF test for co-integration variables: GLD2Y,GDX2Y
CADF t-statistic # of lags AR(1) estimate
-3.12366596 1 -0.046204
1% Crit Value 5% Crit Value 10% Crit Value
-3.880 -3.359 -3.038
hedgeRatio =
5.6534
--------------------------------------------------------------
As you can see they are not cointgrated up to 90% chance. By drawing the residus it shows that the time series is not stationnary.
However, I tried spread= (dailyret(GDX)-dailyret(GLD)) without any regressions or cointegration test ... the spreadseries look meenreverting and stationnary (around 0).
What do you think of this approach?
2/ you mentionned in page 133 : For example, the Canadian
dollar/Australian dollar (CAD/AUD) cross-currency rate is quite
stationary. how can I trade the spread? I did not get the point. should I be long CAD/AUD and short AUD/USD for example? could you explain me more please
Hi Juanjo,
Thank you for your compliments.
Yes, you should manually set the first row of the position array to zero, before applying the fillMissingData function.
Ernie
Hi Amine,
1) Indeed GDX vs GLD sometimes falls out of cointegration, and your test period may be one of those regimes.
But as you observed, even though a pair may not be strictly cointegrating, it can still mean-revert to some extent. You can apply a short term mean reversion strategy to see if it is profitable.
2) AUDCAD is a readily available for trading as one instrument on many FX broker. Just buy low and sell high and vice versa.
Ernie
Hi Ernie,
I have been "debugging" my code and there is a mistake I was stubbornly doing over and over again: I didn't assign positions back after calling to fillMissingData. The code in the book was part in a comment and that got me wrong. I should have read more carefully.
I am now debugging the second part (to detect the look-ahead bias). The code in the website is far more "complicated" than the one suggested in the book. Is there any new revision of the book I'm not aware of?
Kindest Regards,
JJ
Hi Juanjo,
The code on my website sometimes get updated (maybe due to bugs discovered, or other improvements.)
No, I haven't published any revised edition of my books.
Ernie
Hi Ernie,
Thank you very much.
Juanjo
Hi Ernie :
I used your code in your book to backtest the GLD-GDX pair trading. But I got a different sharpe ratio of trainset, which is 0.7856(your book is 2.3). I think the code that I write based on your book is correct. So I wonder maybe the date we used are not the same. I used the price of GLAD and GDX from 5/23/06 to 11/30/07, 385 daily price, are these data you used in the example in the book?
Thank you!
Lucas
Hi Lucas,
As I have described numerous GLD-GDX strategies in the past, please specify exactly which book and which example you are referring to.
Thanks,
Ernie
Hi Ernie,
I've been reading your book recently to learn to become a independent algo trader. It really helps me get to know quant trading quickly. Thanks for your knowledge and experience in the book.
I'm looking forward to your 3rd book (you mentioned it in Quora and said that it will have some A.I. discussions), since I am aiming to build my trading strategy based on A.I..
Cheers,
David
Hi David,
Thank you for your kind words.
Yes, there is a chapter on AI in my 3rd book.
The book is called "Machine Trader", and it is due out in 2017 Q1.
Ernie
Hi Ernest,
Thank you for generously sharing your time and knowledge in writing such an instructive book.
I have a question on Example 3.6 Pairs Trading of GLD and GDX in the 2nd edition of "Quantitative Trading". Specifically, the positions to take in the python code provided
df.loc[df.zscore>=2, ('positions_GLD_Short', 'positions_GDX_Short')]=[-1, 1] # Short spread
df.loc[df.zscore<=-2, ('positions_GLD_Long', 'positions_GDX_Long')]=[1, -1] # Buy spread
Where spread is defined by
spread = GLD - hedgeRatio*GDX
My understanding is that to short the spread, I need to short GLD and long GDX, and to buy the spread through long GLD and short GDX. Is that correct?
If my understanding is not flawed, I would have expected the code to be
df.loc[df.zscore>=2, ('positions_GLD_Short', 'positions_GDX_Long')]=[1, 1] # Short spread
df.loc[df.zscore<=-2, ('positions_GLD_Long', 'positions_GDX_Short')]=[1, 1] # Buy spread
Clearly I am missing something here as the Matlab, Python and R codes are consistent. Could you please advise? Thank you!
Hi Michael,
Yes, your understanding is correct. When we short a spread, we short GLD and long GDX. The first column in the df is for GLD, and so we apply -1 to it. (We distinguish long and short positions in the spread by _Long vs _Short, but a negative position in either case denotes a short position.)
Hope this helps!
Ernie
Hey Ernie,
For the python example 3.6 pairs tarding of gld and gdx in 2nd edition of "quantitiatve trading":
per your book, if you set the following codes for the initial params as:
df['positions_GLD_Long'] = 0
df['positions_GDX_Long'] = 0
df['positions_GLD_Short'] = 0
df['positions_GDX_Short'] = 0
and then after going through the z-score parameterrs, if you do the
df.fillna(method='ffill', inplace=True).
my question: what function does this serve if there are no NaN values since we set starting to zero when creating the columns? should be param be set to np.nan first?
Also, for the codes between matlab, python, and r, are the datasets slightly different which is why different resulting sharpe ratio is given for train and test sets? e.g., python sharpeTrainset = 1.9182, matlab = 2.0822, r = 2.3278. Pardon ignorance, as I have only done the Python example, but am assuming each programming language is the same in terms of logic execution.
Hi plm,
You are correct. My intention was to fill the first row of the positions table with 0 only, and leave the rest as nan. Then after setting the entry and exit signals, we fill forward with the sign of the entry or exit signals.
I will look into modifying the code when I have more time, but perhaps you can try doing it yourself as an exercise to see if it reproduces the answer in Matlab?
Best,
Ernie
Hey Earnie! Really enjoying your book. On the topic of example 3.6, I notice we calculate the spread using the difference between gold and the hedge ratio of GLD/GDX. Maybe this is explained somewhere, but what is the logic behind using this ratio? Also, why do we use it for calculating the spread but not in our position sizing?
Thanks!
Mayan
Hi Mayan,
Thanks for your kind words!
Yes, the hedge ratio is calculated based on a linear regression between GLD and GDX prices. As GLD is the dependent (Y) variable, and GDX the independent variable, this hedge ratio represents how many shares of GDX is needed to hedge 1 share of GLD.
Strictly speaking, you should use that for position sizing too, but I just used equal sizes for simplicity, and just use the hedge ratio for determining the spread and generate trades.
Ernie
Your book is incredibly well-written, with such rich details. I'm truly grateful.
Thanks BirdEggX!
Post a Comment