Wednesday, November 29, 2006

Does Canada belong to the Emerging Markets?

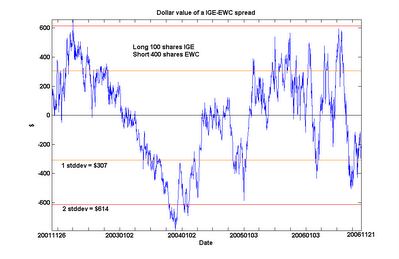
Many of us Canadians like to think of our economy as a member of the advanced, post-industrial world, with the landscape dotted with brand-name companies such as Nortel Networks, Research In Motion, and Four Seasons Hotels. In the back of our minds, of course, we know we are also a resource-rich country. But still, it may come as a bit of an embarrassment to find out that, of all the sector index funds we can compare the MSCI Canada Index fund EWC to, it cointegrates only with the natural resource index fund IGE. Even the financial sector indices do not come close, despite the presence of numerous financial services companies in the Canada Index. As usual, in the chart below, I plotted the spread between 100 shares of IGE and 400 shares of EWC, and we can see for ourselves how this spread stubbornly sticks close to zero.


One may note that IGE also cointegrates with the Emerging Markets index fund EEM. (The chart below is the spread between 100 shares of IGE and 100 shares of EEM.)


This is not surprising. But does this imply the unsettling conclusion that the Canadian economy cointegrates with the emerging markets? No. I will not bore you with yet another chart: just be assured that cointegration is not a transitive relation.

Friday, November 24, 2006

Trading a platinum-gold seasonal spread

Quantitative traders can sometimes lose sight of the fact that many profitable trading strategies are extremely simple, requiring no math at all. Such is the case with a seasonal spread trade between platinum and gold that was profitable in all but one of the last 7 years. This is far more consistent than the seasonal spread trade that ruined Amaranth (see my earlier article).

The strategy is extremely simple: buy 2 July contracts of PL and short 1 June contract of GC around the end of February, and exit the positions around mid-April. (The gold futures contract specifies 100 ounces, while platinum is only 50, therefore we need to buy 2 contracts of PL vs. 1 contract of GC.) I first read about this strategy in an article by Jerry Toepke in the SFO Magazine in the beginning of 2006 and I decided not only to backtest it, but also paper trade this strategy in 2006 to see if it works its magic again. Both the backtest and the paper trade worked as advertised, despite being widely publicized by the magazine. I plot the P/L in this chart:
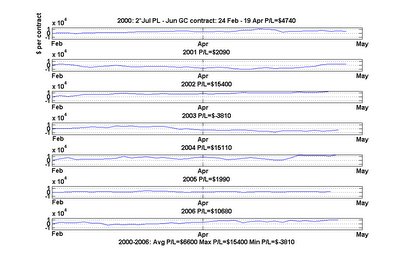

This spread earned an average of $6,600 every year since 1995. We earned $15,400 in the best year, while in the worst year we lose only $3,810. With a margin requirement of only $743 for trading this spread at NYMEX, the return per trade is not bad!

What is the fundamental reason this seasonal spread works? Amusingly, it has to do with the end of the Chinese New Year. According to Mr. Toepke, the demand for gold is driven by demand for jewelry. Asian countries such as India and China are the largest consumers of gold. A series of festivals and celebrations in these countries around year-end lasted till the end of the Chinese New Year in February, after which demand for delivery of gold is seasonally exhausted. Platinum, on the other hand, is primarily used in catalytic converters for automobiles, and the seasonality is much weaker. It is therefore handy as a hedge for gold prices.

Further reading: Jerry Toepke, “Give Seasonal Spreads Some Respect”, Stocks, Futures and Options Magazine, January 2006 issue.
Tuesday, November 21, 2006

Cointegration of OIH with spot oil price

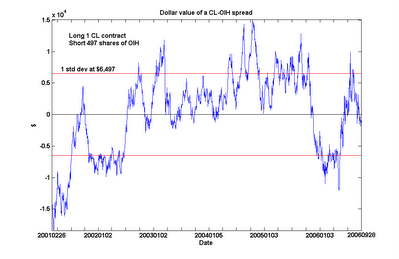
Both my friend Yaser Anwar over at the Investment Ideas blog and my reader Jim urged me to test the oil services ETF OIH instead of XLE for cointegration with crude oil price. Their reasoning is that OIH is composed of oil drilling companies such as Schlumberger and Baker Huhges, as opposed to XLE, which is composed of oil-production companies like Exxon. The oil-drillers are more cyclical and react more to spot oil price rather than far futures contract prices. The hope is that OIH will tend to cointegrate better with spot oil price than XLE because of this. The fact that OIH has higher volatility as a result is not a concern to the arbitrageur (as opposed to the hedger), who profits from high volatility. In any case, its volatility should “cancel out” that of the spot oil price and result in a spread that may actually be less volatile. I follow their advice and carry out the analysis of CL vs. OIH.


The plot is of the dollar value of long 1 contract of Cl and short 497 shares of OIH. They do cointegrate with over 90% probability. (I also plotted the 1 standard deviation lines of the spread to facilitate those who want to look for approximate entry points.) The cointegration probability is not measurably better than that between CL and XLE. However, the current spread (as of the close of Nov 20) is undervalued by only $9,617 (or 1.48 standard deviation), as opposed to $10,508 (or 1.74 standard deviation) for the CL-XLE spread. (I determined the standard deviation of the CL-XLE spread to be about $6,040). So in recent months, one can indeed say that OIH is trading more in line with spot oil price than XLE. But as an arbitrageur who thinks the larger the spread, the bigger the profit opportunity, this is not an endorsement for buying the CL-OIH spread instead. Rather, I would consider adding this spread as a means of diversification.
Thanks, Yaser and Jim, for this suggestion!

Monday, November 20, 2006

Extended analysis of energy futures and stocks arbitrage

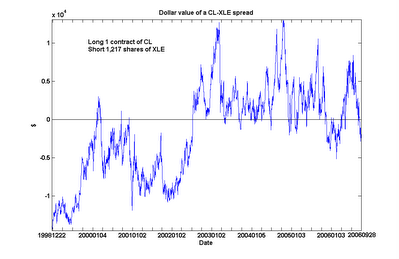
A reader of my article “An arbitrage trade between energy stocks and futures” suggested that I should look at a longer history of crude oil prices vs. XLE. So I performed the same cointegration analysis for the front-month crude oil futures contract CL vs. XLE since December 1998. (I use CL instead of QM, the mini crude oil contract, due to its longer history.) Here is the plot of the dollar value of long 1 contract of CL and short 1,217 shares of XLE. (My previous analysis called for 1 contract of QM vs. 640 shares of XLE. The difference in shares is due to the half-size of QM relative to CL, and also to the larger dataset here.)


An interesting feature emerged from this extended analysis. CL and XLE are still found to be cointegrated over this long period, albeit with a slightly lower probability (90%). However, we can see something of a regime shift around mid-2002, when CL went from generally under-valued to over-valued relative to XLE. (Even after including this regime with lower relative crude oil prices in my calculations, I still find the current spread to be undervalued by about $10,521 as of the close of Nov 17, which is near its 6-year low.)

What was the reason for this apparent shift in mid-2002? And are we in the middle of a similar regime shift in the opposite direction? Maybe our readers who have a better grasp of the economic fundamentals of the energy markets can shed light on this.

Sunday, November 19, 2006

Email subscription to my blog now available

Instead of checking this blog constantly for new postings, you can now sign up to receive an email whenever a new article appears. Please see the "Enter your email" box on the right sidebar. You can of course unsubscribe at anytime, and your email will not be shared with anyone else without your permission.

Saturday, November 18, 2006

Correction: Maximizing Compounded Rate of Return

A few readers pointed out a typo and an arithmetic error in my article "Maximizing Compounded Rate of Return". In the geometric random walk example where the stock can go up or down 1% at every step, the mean rate of return m is 0%, (not 1%), and the compounded rate of return is -0.005% (not -0.5%). My sincere thanks to all my readers who mercilessly scrutinize my ideas and check my numbers!

Friday, November 17, 2006

Reader suggested a possible trading strategy with the GLD - GDX spread

Steve Hansen of Raymond James Ltd. in Vancouver, B.C. suggested to me that a good trading signal for the GLD - GDX spread is when it exceeds 2 standard deviations from its mean. He observed that these are roughly at +/- $250 based on my definition of the spread, and that there were 3 such (immensely profitable) signals since the inception of GDX. Here is Mr. Hansen's plot:


This certainly looks like a fairly safe strategy. Of course, if one desires more frequent signals, one can always enter into smaller positions at smaller spread values.

By the way, just when we were celebrating the reversion of the GLD - GDX spread this morning, the QM - XLE spread plunged to another multi-year low. With crude oil prices down about 30% from its all-time-high, XLE, the energy stocks ETF, is still within 5% of its all-time high. Does this make any sense? We shall see after this quarter's earnings from the oil companies are announced ...

GLD-GDX spread reverted to 0 this morning

Just a quick note on the GLD-GDX spread that I have been talking about. This morning (Nov 17) the negative spread completely reverted and has gone into positive territory.

Sunday, November 12, 2006

An updated analysis of the arbitrage between gold and gold-miners

In my article about the arbitrage opportunity between gold and gold-miners, I cautioned that we should take the analysis with a grain of salt because of the short history of GDX (a gold-miners ETF). Adam Phillips of Van Eck Global, the firm which created GDX, has kindly pointed out to me that GDX is designed to track the Amex Gold Miners Index, GDM, which has a much longer history. Hence I repeated the analysis with gold spot prices vs. GDM for the last 3 years. The results confirm my earlier analysis with much higher statistical significance: GDM cointegrates with gold prices with over 99% probability. Here I plot the difference between the spot prices of 6.1 troy ounce of gold and the GDM index multiplied by 3.68 (to compare with my earlier plot, I normalize the gold prices and the GDM index so that the Gold-GDM spread yields roughly the same dollar value as the GLD-GDX spread at any time):


The mean-reversion of this spread is even more obvious than my plot in the earlier article. Also, with the longer history, we get a much better feel for the range of fluctuations. While the value of the spread is about -$213 as of the close of Nov 9, it can certainly go much lower before reverting, based on the highs and lows of the last 3 years.


FOOTNOTE

A reader of my earlier article made an interesting comment about shorting ETF’s such as GDX and GLD. He argued that since ETF shares can be constantly created, it should not require existing shares to be borrowed for shorting. I asked Mr. Phillips of Van Eck Global about this, and he confirmed to me that a newer ETF like GDX can in fact be hard to borrow. He went on to say that the borrowing of ETF’s has nothing to do with the issuer. The issuer can indeed create an unlimited supply of the shares, but the trader still need to borrow them from his or her broker for shorting. He also told me he is currently working hard to eliminate any borrowing problems in GDX that may have existed.

Friday, November 10, 2006

A commodities fund manager's comments on gold vs gold-miners arbitrage

John Netto, a principal in a commodities fund that focuses heavily on gold, wrote me the following concerning my article on arbitrage between gold and gold-miners: "... there is a paradox that exists in many instances with gold companies and the underlying metal, which could potentially unwind most pairs traders. This is the dynamic of non-recourse loans that companies take on when doing a project. This would never show up in a quantitative model but can put companies in a position that when gold rises, they can get hurt to some degree. Banks that do non-recourse loans require the companies to sell futures to guarantee payment for the project in case the price of gold falls. This way, they will not lose if the project no longer becomes a viable business endeavour. If gold rises, these companies must show massive mark-to-market losses on their books based on new accounting rules. So the theory that gold companies can trade correlated to the price of the underlying is correct, however a dynamic exists that has the potential on a per company basis to materially affect that."

I find Mr. Netto's comments very insightful. I would make one further point: if the mark-to-market accounting losses are temporary and will recover next quarter, we can expect their stock prices to revert. This is exactly the cointegration scenario that I talked about -- a price reversion after some period of time, but not a day-to-day or week-to-week correlation.

Wednesday, November 08, 2006

Are political futures markets really predictive?

Today I will take a brief break from quantitative trading in the financial markets. Instead, I will take a critical look at political futures markets. There has been a lot of enthusiasm lately for such markets (e.g. www.tradesports.com, based in Ireland, is the most popular one.) Media pundits and scholars alike have often said that these markets offer a better prediction of election outcomes than opinion polls, sometimes claiming that they beat polls three-quarters of the time. I have been an avid participant in these markets, but I would like to offer a contrarian view: I believe that these markets often follow, rather than predict, events. The so-called “predictability” of these markets is often ill-defined. The prediction changes constantly over time, and so depending on when you take a snapshot of the markets, you can always find an instant when, retrospectively, the prediction matches the actual election outcomes very closely.

As an example, I watched with amusement the tradesports.com futures market prediction of the Virginia Senate race between Democrat Jim Webb and Republican George Allen. This is one of the two close races that will determine the control of the Senate. For months, the market predicts that the Democrat will lose (the probability of winning, which is the same as the price divided by 100, is always below 50% until the beginning of November). Then in November, the market began to see the light, and started to predict a Democratic win. See the chart below.


But look what happened on the night of the election:


As the vote counts started to be released, the market first thought the Republican was going to win, driving the prices down to the teens. That was due to the votes from the conservative southern Virginia, which were the first to come in. Then, as the vote counts from the more liberal northern Virginia were published at around 11:30 pm, the prices shot up to above $60, and continued on to over $80. Clearly, the market does not know more about the future than your average news anchor.

As someone interested in the predictability of election outcomes based on futures markets, this raises a serious question. What is the proper time to take a snapshot of the market? Should it be 1 month before the election (in which case this market prediction failed, presuming a Democratic win after the recount)? Or should it be 1 week before the election, in which case this market prediction succeeded? And without an answer to this question, how can one claim whether the prediction is accurate or inaccurate?

Monday, November 06, 2006

Cointegration is not the same as correlation

A reader asked me recently why I believe that energy stock prices (e.g. XLE) are correlated with crude oil futures front-month contract (QM). Actually I don’t believe they are necessarily correlated – I only think they are “cointegrated”.

What is the difference between correlation and cointegration? If XLE and QM were really correlated, when XLE goes up one day, QM would likely go up also on the same day, and vice versa. Their daily (or weekly, or monthly) returns would have risen or fallen in synchrony. But that’s not what my analysis was about. I claim that XLE and QM are cointegrated, meaning that the two price series cannot wander off in opposite directions for very long without coming back to a mean distance eventually. But it doesn’t mean that on a daily basis the two prices have to move in synchrony at all.

Two hypothetical graphs illustrate the differences. In the first graph, stock A and stock B are correlated. You can see that their prices move in the same direction almost everyday.

Now consider stock A and stock C.

Stock C clearly doesn’t move in any correlated fashion with stock A: some days they move in same direction, other days opposite. Most days stock C doesn’t move at all! But notice that the spread in stock prices between C and A always return to about $1 after a while. This is a manifestation of cointegration between A and C. In this instance, a profitable trade would be to buy A and short C at around day 10, then exit both positions at around day 19. Another profitable trade would be to buy C and short A at around day 31, then closing out the positions around day 40.
Cointegration is the foundation upon which pair trading (“statistical arbitrage”) is built. If two stocks simply move in a correlated manner, there may never be any widening of the spread. Without a temporary widening of the spread in either direction, there is no opportunity to short (or buy) the spread, and no reason to expect the spread to revert to the mean either.

For further reading:

Alexander, Carol (2001). Market Models: A Guide to Financial Data Analysis. John Wiley & Sons.


Thursday, November 02, 2006

Gold vs. gold-miners: another arbitrage opportunity?

Recently there is mounting interest in buying gold (for example, see this report at TheStreet.com). I am not much of a fundamental analyst, so I won’t go into the economic reasons whether to own or not own gold now. Rather, I would like to see if there is an arbitrage opportunity here in the midst of all this excitement.

I talked about before why I believe energy futures and energy companies ETF are “cointegrated”, i.e. when their spread wanders far from a mean value, there is a high probability that they will revert to the mean. The same analysis can be made about other pairs of commodity futures and ETF’s. Therefore I apply this to gold.

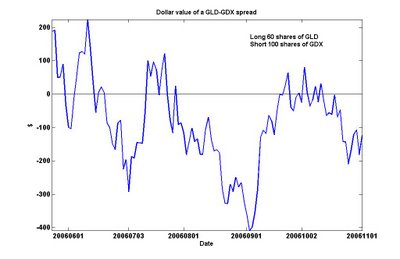
Looking around for ETF’s that hold gold miners, I found GDX. It started trading on May 23, 2006 and therefore has a relatively short history for us to analyze. We could have paired it against the front-month gold futures contract GC, but this may be inconvenient because one has to rollover the contracts monthly. So instead, we pair it against an ETF that holds gold as a commodity. GLD is one such example. (So is IAU, but GLD is far more liquid.) Using the same Matlab cointegration package that I mentioned in the previous article, I determine that even with the short history, GLD cointegrates with GDX with a 90% probability. Also, the package tells us the proper combination is 60 shares of GLD vs. 100 shares of GDX. So if we form a pair by buying 60 shares of GLD and shorting 100 shares of GDX, we can plot the value over time here:


There were indeed numerous instances of reversion to the mean. I was able to take advantage of the high around mid-July and shorted this spread profitably, and I also bought the spread around the low in early September and exited my positions profitably around mid-September. As of the 1st of November, the spread is once again in sufficiently negative territory to warrant attention.

There are some caveats with trading this spread. First, it is not always easy to borrow GDX or GLD to short. It depends on if your broker has a good securities lending desk. Secondly, the history of GDX is short. So any analysis must be taken with a grain of salt. To overcome this short history, I could have constructed my own basket of gold mining stocks and plot the price of this basket against the gold futures GC. If you intend to invest heavily into this spread, I would definitely recommend doing this piece of hard work.


Wednesday, November 01, 2006

An update on the energy stocks vs futures arbitrage trade

I argued before in the beginning of October ("An arbitrage trade between energy stocks and futures") that energy stocks are overvalued relative to energy futures. At that time, a portfolio of long 1 front month QM (crude oil Emini future contract) and short 640 shares of XLE (energy stocks ETF) has a value of -$2,584. Where is it now? As of the close of October 31, December QM is at $58.725, while XLE is at $55.73 a share. The portfolio is now at -$6,305 (the multiplier for QM is 500). The spread has clearly widened: it is now at a 3-year low.

We are now faced with the usual arbitrage trader's quandary. Is this an unprecendented profit opportunity to double up on this trade, or was this a colossal blunder on my part? I came across this New York Times article about the earnings reports from Exxon and Shell that gave me some comfort. While both energy companies posted huge profits, the article quoted Fadel Gheit, a senior energy analyst at Oppenheimer & Company, that for the fourth quarter, "“the question is not if earnings will decline, the question is by how much.” According to the article, analysts say that for every dollar the price of a barrel of crude oil drops, Exxon forgoes $500 million in profit.

So yes, with my fingers crossed, I am still waiting for the day when this spread closes up.