As oil prices go to historic highs during this past year, energy stocks have followed a similar course. For example, front-month light sweet crude oil E-mini contract QM reached a historic intraday high of $78.30 on July 14, while the energy sector exchange-traded fund XLE reaches its historic intraday high of $60.15 on May 11. Since energy companies typically own rights to oil either above or under ground, it is reasonable that their stock prices follow the price of oil. In technical terms, we say that energy stock price “cointegrates” with the crude oil price, a concept pioneered by the Nobel laureates Robert Engle and Clive Granger. To prove that they do in fact cointegrate, I ran a Matlab cointegration package developed at University of Toledo in Ohio on the closing prices of QM (using a perpetual futures series) and XLE for the last 3 years. The program determined that they cointegrate with a 95% probabilty. Now, what this does not mean is that QM and XLE prices will always move up or down in a similar percentage everyday. This also doesn’t mean that there won’t be periods of time when the spreads between QM and XLE will go way out of sync, just as the gas futures spread did for Amaranth. What this tells us is that with high probability, the spread will eventually goes back to their historic average, and then probably goes in the opposite direction for a while.
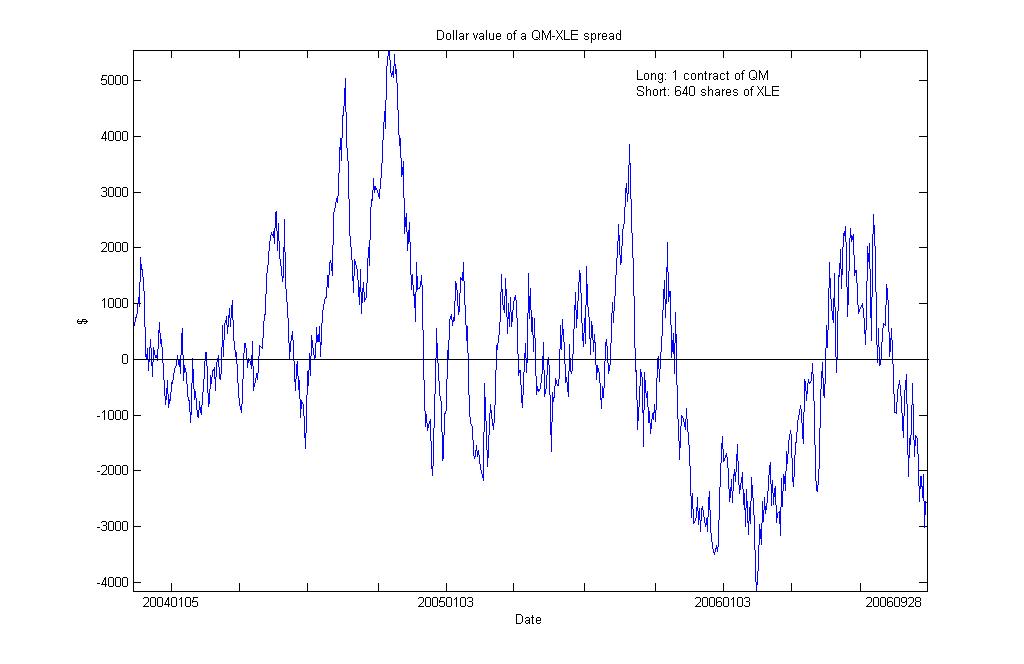
To illustrate this point, let’s take a look at a plot of the spreads between QM and XLE over the last 3 years. (Click on the graph twice to enlarge it.) Suppose we are long a front-month QM contract (rolling over the contract every month), and are simultaneously short 640 shares of XLE. The number of shares is determined by the Matlab package mentioned above. The y-axis shows the dollar value of this pair of positions. We can see that in the past 3 years, the value went as high as $5,550 on October 14th, 2004, and as low as -$4,152 on February 16th, 2006. The average is $57, which is almost zero. As of this writing (at the close of September 28, 2006), the value is -$2,584. While this is not near the 3-year low yet, it is getting there. Those who have a strong stomach will buy this spread now, and hope that the value will move back up to it long-run average of near zero. (Click on the graph twice to enlarge it.)
Some thoughtful readers may wonder whether there are any fundamental reason energy stocks have dropped much less in value since the summer than energy futures prices. Now energy companies are valued much like any other companies: roughly speaking, their stock is worth the present value of their anticipated future cash-flow plus their current net asset value. The current net asset value certainly should follow the front-month crude oil contracts very closely, in fact, more closely than their stock price. However, their anticipated future cash-flow reflects the expected price of oil in the years to come, not the current cash price of oil. (For those readers who enjoy a bit of exercise, they can look up the oil contracts that expire in 2007, 2008 and beyond to see if they in fact has higher prices than the front contract.) At this time, the stock (and futures) market is telling us this: oil price will go back up in the future.
21 comments:
EC-
How can one get the Matlab package?
EC-
Also wanted to ask you if a trader is trading this pair trade, how does he hedge himself?
What I like to do usually is- say I'm bullish on oil, in fact I'll tell you my position right now. I'm long OIH and going to short USO as a hedge.
What I like to do is, say I've got 1000$ which I'll put into this hedged trade. If I believe higher probability is for oih to rise, I buy 700$ of OIH and short 300$ for XLE/USO. Do you think that's a good approach?
Matlab itself can be bought from www.matlab.com. There is a student license which is much cheaper than the normal one. The cointegration package can be downloaded freely from
http://www.spatial-econometrics.com/
Yaser: I can tell you the ratio for an XLE-USO spread. (I haven't done the analysis for the OIH-USO spread.)
If you believe this spread is under-valued, and you want to buy 100 shares of XLE, then I would recommend shorting 81 shares of USO.
Note that the long and short side is not exactly dollar-neutral -- the ratio is determined by the cointegration package. Note also the analysis is based on fixed number of shares. Unlike delta-hedging in options trading, no dynamic re-adjustment of number of shares are needed here as the value of the spread changes.
does the add-in for matlab work with scilab?
I have not used scilab before so I am not qualified to answer your questions, but my guess is that matlab packages work only on Matlab, O-matrix and Octave. Please feel free to email me for further questions.
-Ernie
how did the spread USO-XLE work out?
did it return to 0?
what was the exact conintegration-relation you found?
Dear anonymous,
Unfortunately, as of 3/7/07, the USO-XLE spread still stood at about -3 s.d. away from zero, though it is narrowing from its recent month's low. As I mentioned in a recent
article, it may take up to a year for it to converge.
The spread is defined as long 100 shares of USO vs short 122 shares of XLE.
Ernie
Ernie, is it possible to turn on dates for the comments? It is interesting to see the development of stories over time. Thanks!
Dear anonymous,
Thanks for the time-stamp suggestion. It is done!
Ernie
EC, any reason why I shudn't go for R for cointegration analysis?
It is freely available.
Dear anniyan,
You can use any platform you like to do the analysis -- I am, however, not aware of a free R cointegration package, while there is one for Matlab.
Ernie
Ernie: This comment is simply regarding some practical aspects of this spread trade.
I've had good luck implementing one leg using the WTI crude oil futures on ICE; and the other leg using a combination of XLE single-stock futures (SSF) and out-right XLE shares. The beauty of using futures is that the trade is much less capital-intensive.
Note that the SSF for XLE is one thousand shares notional size, not one hundred like most SSFs. This is because XLE is an ETF.
For sizing, I simply choose a number of XLE shares to balance the dollar volatility of the WTI contract. Recently, that's meant 1130 shares of XLE for every WTI contract; or, using SSFs, one SSF plus 130 out-right shares for every WTI contract.
You can use the CL futures on NYMEX instead of WTI on ICE. But the WTI is cash-settled, making it much more convenient. And the CL futures expire before the delivery month, so you need to watch the calendar carefully.
This has been a very profitable trade, simply by entering on the extreme Z scores and covering when it returns near normal. I hope other readers can profit from your idea, too.
Ernie,
I stumbled upon your blog and am reading with great interest. I've noticed that you use a ratio for this pair trade based on the cointegration package from Matlab. How is this ratio any different in performance vs. just using a fixed dollar ratio for the pair as I have seen from other articles and bloggers on pair trading? Thx.
Anonymous,
Generally, a dynamically adapted hedge ratio based on a certain lookback period has better trading performance than a static ratio. I have not tried the different methods of dynamically adapting the hedge ratio -- I have only used the linear regression method as it is more theoretically sound.
Ernie
Ernie,
I was wondering what you thought about the apparent recent cointegration between XLE and SPY.
Also, could you reccomend a cointegration package for R? Thanks.
Corey
Corey,
If we compute cointegration using only the last year or two data on SPY and XLE, they do seem cointegrated, but not so if you use longer periods. I don't believe cointegration test using only 2 years of data is reliable enough for a good trading strategy. The cointegration may fall apart in the future.
I am not familiar with R. I think Google probably will have a better recommendation!
Ernie
Hi -
I'm wondering what the matlab cointegration statistics are saying? Using the USO-XLE as an example, I just downloaded the last 3.5 years of data. The regression shows the ratio to be +100 USO, -154 XLE. But using the tseries package, an ADF and PP test show very high p-values, which suggests this series is no longer cointegrated. Which tests does the matlab cointegration package use?
jh,
It is very possible that USO-XLE are no longer cointegrated. We update our pairs every so often, and remove those pairs that fall out of cointegration.
Ernie
Ernie, I think we could all learn a lot by revisiting your QM/XLE pair that you entered Sept 2006. You wrote an update on Jan 2007 that you were still in the trade after 104 days. By looking at the chart of USO and XLE it appears that it took about 500 days for that pair to revert.
When the half life of 70 days was exceeded, the damage was already done. At that time the expectation for further drawdown must have been much smaller than the expectation of reversion (and history did indeed unfold as per such expectations).
How long did you hold that trade? If the same setup occurred today would you enter it again? What can you teach us about that trade in retrospect?
Ken,
Given I know now about the tendency of regime shift in oil futures (from contango to backwardation and back, see also my blog post http://epchan.blogspot.com/2011/01/shorting-vix-calendar-spread.html)
I would not have traded this spread at all.
Ernie
Post a Comment